
Bakery financial projections are a three-year forecast of revenue, costs, profit, and cash, built from your own assumptions rather than industry averages. They are the section of the plan a lender reads hardest, and the section most first-time owners write last and worst.
The blank spreadsheet is the problem. You are being asked to forecast a business that does not exist yet, and the honest answer, “I don’t know,” is not on the form. What follows is a method that produces defensible numbers anyway: build from transactions upward, cost every line separately, and be explicit about which assumptions you are least sure of. This is the financial half of the plan; the complete bakery business plan guide covers the written sections that surround it.
Key Takeaways
- Forecast revenue from customers and average ticket. A revenue number chosen first and justified afterward is obvious to anyone who lends for a living.
- Cost of goods sold generally runs 25–35% of revenue in a bakery; labor commonly approaches 30% in a staffed operation. Those two lines decide the forecast.
- Break-even is fixed costs divided by contribution per unit. A bakery with $3,500 in monthly fixed costs and $4 of contribution per loaf needs 875 loaves a month.
- The cash flow forecast is a separate document from the profit and loss, and it is the one that tells you whether you can make payroll.
- Forecast a ramp. New bakeries do not open at steady-state volume, and plans that assume otherwise run out of money in month four.
Lower your delivery costs by 23%
How we reduce costs:
- No delivery vehicle expenses
- Optimized local routes
- Pay-per-delivery model
- Average 23% delivery cost reduction
What Goes in the Financial Section
Six components, in this order:
- Startup costs: everything spent before you take a dollar
- Revenue forecast: monthly for year one, annual for years two and three
- Cost of goods sold and operating expenses
- Profit and loss statement: the three above, assembled
- Cash flow forecast: timing, not profitability
- Break-even analysis and funding request
Most free plan templates give you headings for these and no method. If you want a filled example to check your line items against, several of the free bakery business plan templates include complete financial exhibits for a fictional bakery. Useful as a checklist, useless as numbers.
Metrobi is transforming bakery deliveries
Specialized solutions for bakery businesses:
- Bakery-trained drivers
- Proper handling equipment
- Peak day delivery support
- 23% average cost reduction
Step 1: Forecast Revenue From Transactions, Not Targets
Build revenue from the smallest unit you can actually estimate, then multiply up. For a retail bakery that unit is a transaction.
Retail forecast:
Daily revenue = customers per day × average ticket
Monthly revenue = daily revenue × operating days
A bakery serving 120 customers a day at a $9.50 average ticket, open 26 days a month, forecasts $29,640 in monthly retail revenue.
Now defend both inputs. Average ticket comes from your own menu prices and a realistic basket: one pastry and a coffee, not the maximum someone could theoretically spend. Customer count is the harder one, and there are three ways to estimate it honestly:
- Foot traffic. Count people passing the location during your intended opening hours, on a weekday and a weekend, and apply a conversion rate. Two to five percent is a common starting assumption for a new food retailer with good signage.
- Comparable bakeries. If a similar bakery two neighborhoods over does roughly known volume, say so and adjust for the difference in traffic.
- Capacity. What can your oven and your staff actually produce and sell in a day? This is a ceiling, not a forecast, but it catches projections that are physically impossible.
Wholesale forecast works differently and belongs on its own line:
Monthly wholesale revenue = accounts × average order value × deliveries per month
Twelve cafés at $180 per order, delivered twice a week, is $18,720 a month. Wholesale is more predictable than retail and carries thinner margins, so mixing the two into one revenue line hides the thing a lender wants to see. This transactions-upward method is not bakery-specific: a farm business plan builds its revenue line the same way, from buyers and order sizes rather than from a target.
Then apply a ramp. A new bakery does not open at full volume. Forecast month one at 40–50% of steady state and climb over six to nine months. Plans that skip the ramp overstate first-year revenue by a wide margin and understate the working capital needed to survive it.
Step 2: Build the Cost Lines
Split costs into variable (they move with sales) and fixed (they do not). The split is what makes break-even calculable later.
Cost of goods sold (variable). Ingredients and packaging. Cost this from your own recipes rather than a percentage: weigh what goes into a batch, price it from a supplier quote, divide by yield. Then check the result against the norm. Bakery COGS generally runs 25–35% of revenue, with many operators targeting under 30% (BakeProfit, retrieved 2026-09-08). If your recipe costing says 18%, you have made an arithmetic error or forgotten packaging.
Labor (mostly fixed, partly variable). Build it from the staffing schedule in your operations plan: roles, hours, wage rates, plus payroll taxes and any benefits at roughly 10–15% on top of gross wages. Labor commonly approaches 30% of revenue in a staffed bakery, which makes it the single largest controllable line.
Occupancy (fixed). Rent, common area charges, utilities, insurance. Use your actual quoted rent, not a per-square-foot average.
Everything else (fixed). Equipment leases or loan payments, POS and software subscriptions, accounting, marketing, licenses, repairs, delivery costs if you run wholesale or online orders, and a miscellaneous line at 2–3% of revenue.
Waste (variable, and usually missing). Unsold product is a real recurring cost. Forecast it explicitly at 5–10% of production and you will be closer than a plan that assumes everything baked gets sold.
Step 3: Assemble the Profit and Loss
Monthly rows for year one, annual for years two and three:
| Line | Month 1 | Month 6 | Month 12 |
|---|---|---|---|
| Revenue (retail) | $13,000 | $24,000 | $29,600 |
| Revenue (wholesale) | $4,000 | $12,000 | $18,700 |
| Total revenue | $17,000 | $36,000 | $48,300 |
| COGS (30%) | $5,100 | $10,800 | $14,500 |
| Gross profit | $11,900 | $25,200 | $33,800 |
| Labor | $12,000 | $13,500 | $14,500 |
| Occupancy | $4,800 | $4,800 | $4,800 |
| Other operating | $2,400 | $3,000 | $3,400 |
| Net profit | –$7,300 | $3,900 | $11,100 |
The negative first months are the point. A forecast with no losses in year one is not credible for a bakery, and showing them is what justifies the working capital in your funding request. Where the year-three net margin lands is the number readers will benchmark. Bakery profit margins by format sets out what is realistic, and a forecast arriving at 25% net for a retail storefront will be read as fantasy.
Step 4: Build the Cash Flow Forecast
Profit and cash are different, and the difference has closed bakeries that were profitable on paper.
The profit and loss records a sale when it happens. The cash flow forecast records money when it moves. Three gaps matter for a bakery:
- Wholesale receivables. Retail pays instantly; wholesale accounts pay on 15- or 30-day terms. A month of strong wholesale growth is a month of weak cash.
- Inventory and deposits. Ingredients are bought before the product is sold. Suppliers may want payment before you have banked the sale.
- Loan principal. Interest hits the P&L; principal repayment only hits cash.
Build the cash flow monthly for all of year one and quarterly after that. The line that matters is the closing cash balance. If it goes below zero in any month, the plan does not work yet. Either the funding request goes up or the ramp assumptions come down.
Step 5: Calculate Break-Even
Break-even is the sales volume at which you stop losing money. It is short arithmetic and lenders check it first.
Contribution per unit = price − variable cost per unit
Break-even units      = fixed costs ÷ contribution per unit
A bakery with $3,500 in fixed monthly costs, selling loaves at $5 that cost $1 in ingredients and packaging, contributes $4 per loaf and breaks even at 875 loaves a month, about 34 a day on a 26-day month.
The same logic scales. A bakery carrying roughly $25,000 in monthly fixed overhead, with variable costs around 40% of revenue, needs about $41,700 in monthly sales to break even, or roughly $1,389 every operating day.
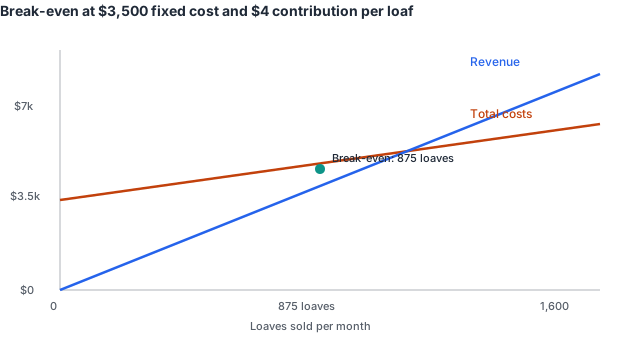
Illustrative model using the worked example above. Contribution per loaf is price minus ingredient and packaging cost; fixed costs are assumed flat across the range.
Express break-even three ways in the plan: units per month, revenue per month, and the month your forecast reaches it. The third is what the lender is really asking.
Step 6: Startup Costs and the Funding Request
Startup costs are everything spent before the first sale: equipment, build-out, initial inventory, permits and licenses, deposits, professional fees, signage, POS, and the line most plans omit: working capital to cover the losses in the ramp. Work through a category-by-category breakdown of what it costs to open a bakery before you price this section, so the totals come from quotes rather than estimates.
Take the largest cumulative negative cash position from your year-one cash flow, add a 15–20% contingency, and that is your working capital requirement. A bakery that needs $9,000 of working capital and raises none is not underfunded by a little; it is going to run out at exactly the moment volume is finally climbing.
The funding request itself is three sentences: how much you need, what it buys broken into categories, and how it gets repaid, pointing at the cash flow forecast.
Cost Lines Bakery Forecasts Routinely Miss
- Payroll taxes and workers’ compensation on top of gross wages
- Waste and shrinkage, budgeted as a line rather than absorbed silently into COGS
- Credit card processing, roughly 2.5–3% of card revenue, which is most of it
- Equipment maintenance and repair. Ovens fail, and they fail at 4 a.m.
- Delivery costs for wholesale and online orders: vehicle, fuel, driver hours, per stop
- Seasonality. Most bakeries have a slow stretch, and a flat monthly forecast hides it
- Owner’s compensation. If you do not pay yourself in the forecast, the forecast is wrong
How to Defend Your Assumptions
Every forecast rests on assumptions, and lenders do not expect certainty. They expect you to know which numbers you are least sure of.
Include a short assumptions page listing the key inputs (customer count, average ticket, COGS percentage, ramp length, wage rates) with a source for each: your own recipe costing, a supplier quote, an observed foot-traffic count, a comparable bakery. Then run two sensitivities: what the cash position looks like if revenue lands 20% below forecast, and what happens if ingredient costs rise 10%.
A plan that shows the downside and still survives it is more persuasive than one that shows only the base case. The owner who has already thought about a bad January is the one a lender wants to lend to.
Frequently Asked Questions
How many years of financial projections does a bakery business plan need?
Three years is standard: monthly detail for year one, annual for years two and three. Some lenders ask for five, but the additional two years are widely understood to be directional. Precision beyond year one is not expected; internal consistency is.
What if I have no historical data to forecast from?
That is the normal case for a startup bakery, and the method above is designed for it. Build from observable inputs rather than from a revenue target: your own menu prices, your recipe costs, counted foot traffic, quoted rent, actual wage rates. Every one of those is verifiable, which is what makes the forecast defensible even though the outcome is uncertain.
What is a realistic first-year revenue for a new bakery?
There is no useful single figure, because a home bakery and a bakery café with seating differ by an order of magnitude. Build your own number from transactions and average ticket, then check it against your production capacity. If the forecast requires more product than your oven can make, revise the forecast.
Should the break-even analysis use units or revenue?
Both. Units are more useful to you for daily management, because 34 loaves a day is a number the team can act on. Revenue is more useful to a lender comparing your plan to others. Present the calculation in units and state the revenue equivalent.
How do I forecast wholesale revenue before I have any accounts?
Forecast conservatively and stage it. Name the specific cafés, restaurants, or grocers you intend to approach, assume a low conversion on that list, and add accounts gradually across the ramp rather than all at once. Include the delivery cost per account from month one, since that cost starts with the first delivery regardless of volume.
Do I need accounting software to build these projections?
No. A spreadsheet is sufficient and is what most lenders receive. What matters is that the profit and loss, cash flow, and break-even all draw on the same assumption set, so that changing the customer count in one place updates every dependent figure. That single habit prevents the most common error in submitted forecasts: three exhibits that contradict each other.